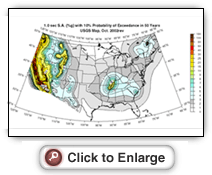
Hazard maps show the relative expectation of earthquake ground motion throughout the U.S. Specifically, the maps show the probability (currently 2%) that a given area will experience earthquake ground motions greater than a certain value in a 50-year period.
|